The GameMaps from the past six Steelers-Ravens games: The teams have played six times since the beginning of the 2014 season. The presentation is chronologically backwards. Every possession in exact game sequence – test your recollection of past games from this heated rivalry. Prep for Sunday. Ravens hold a 5-1 advantage including four straight. Do enjoy the visualizations and use them in conjunction with the other posts from my colleagues. It is good to be back with these talented writers.
Randall’s view of the good for Ravens in previous games vs Steelers
(You can discuss this on the BSL Board here.)
What is a GameMap?
Small excerpt from MIT Sloan Research Paper Competition by Guyader and Sklar, 2016 [this is why I have been away for a few weeks – this paper competition took a huge amount of effort]
For many, this metric will change the interpretation and recollection of on-field performance. The accompanying visualization scheme aides an industry dominated by decision makers favoring visual and kinesthetic learning pedagogies. The visual presentation of the metric values and drive markers will aide in the recollection of current or past games.
What is to be sought in designs for the display of information is the clear portrayal of complexity. Not the complication of the simple…… the revelation of the complex. (Tufte, 2001)
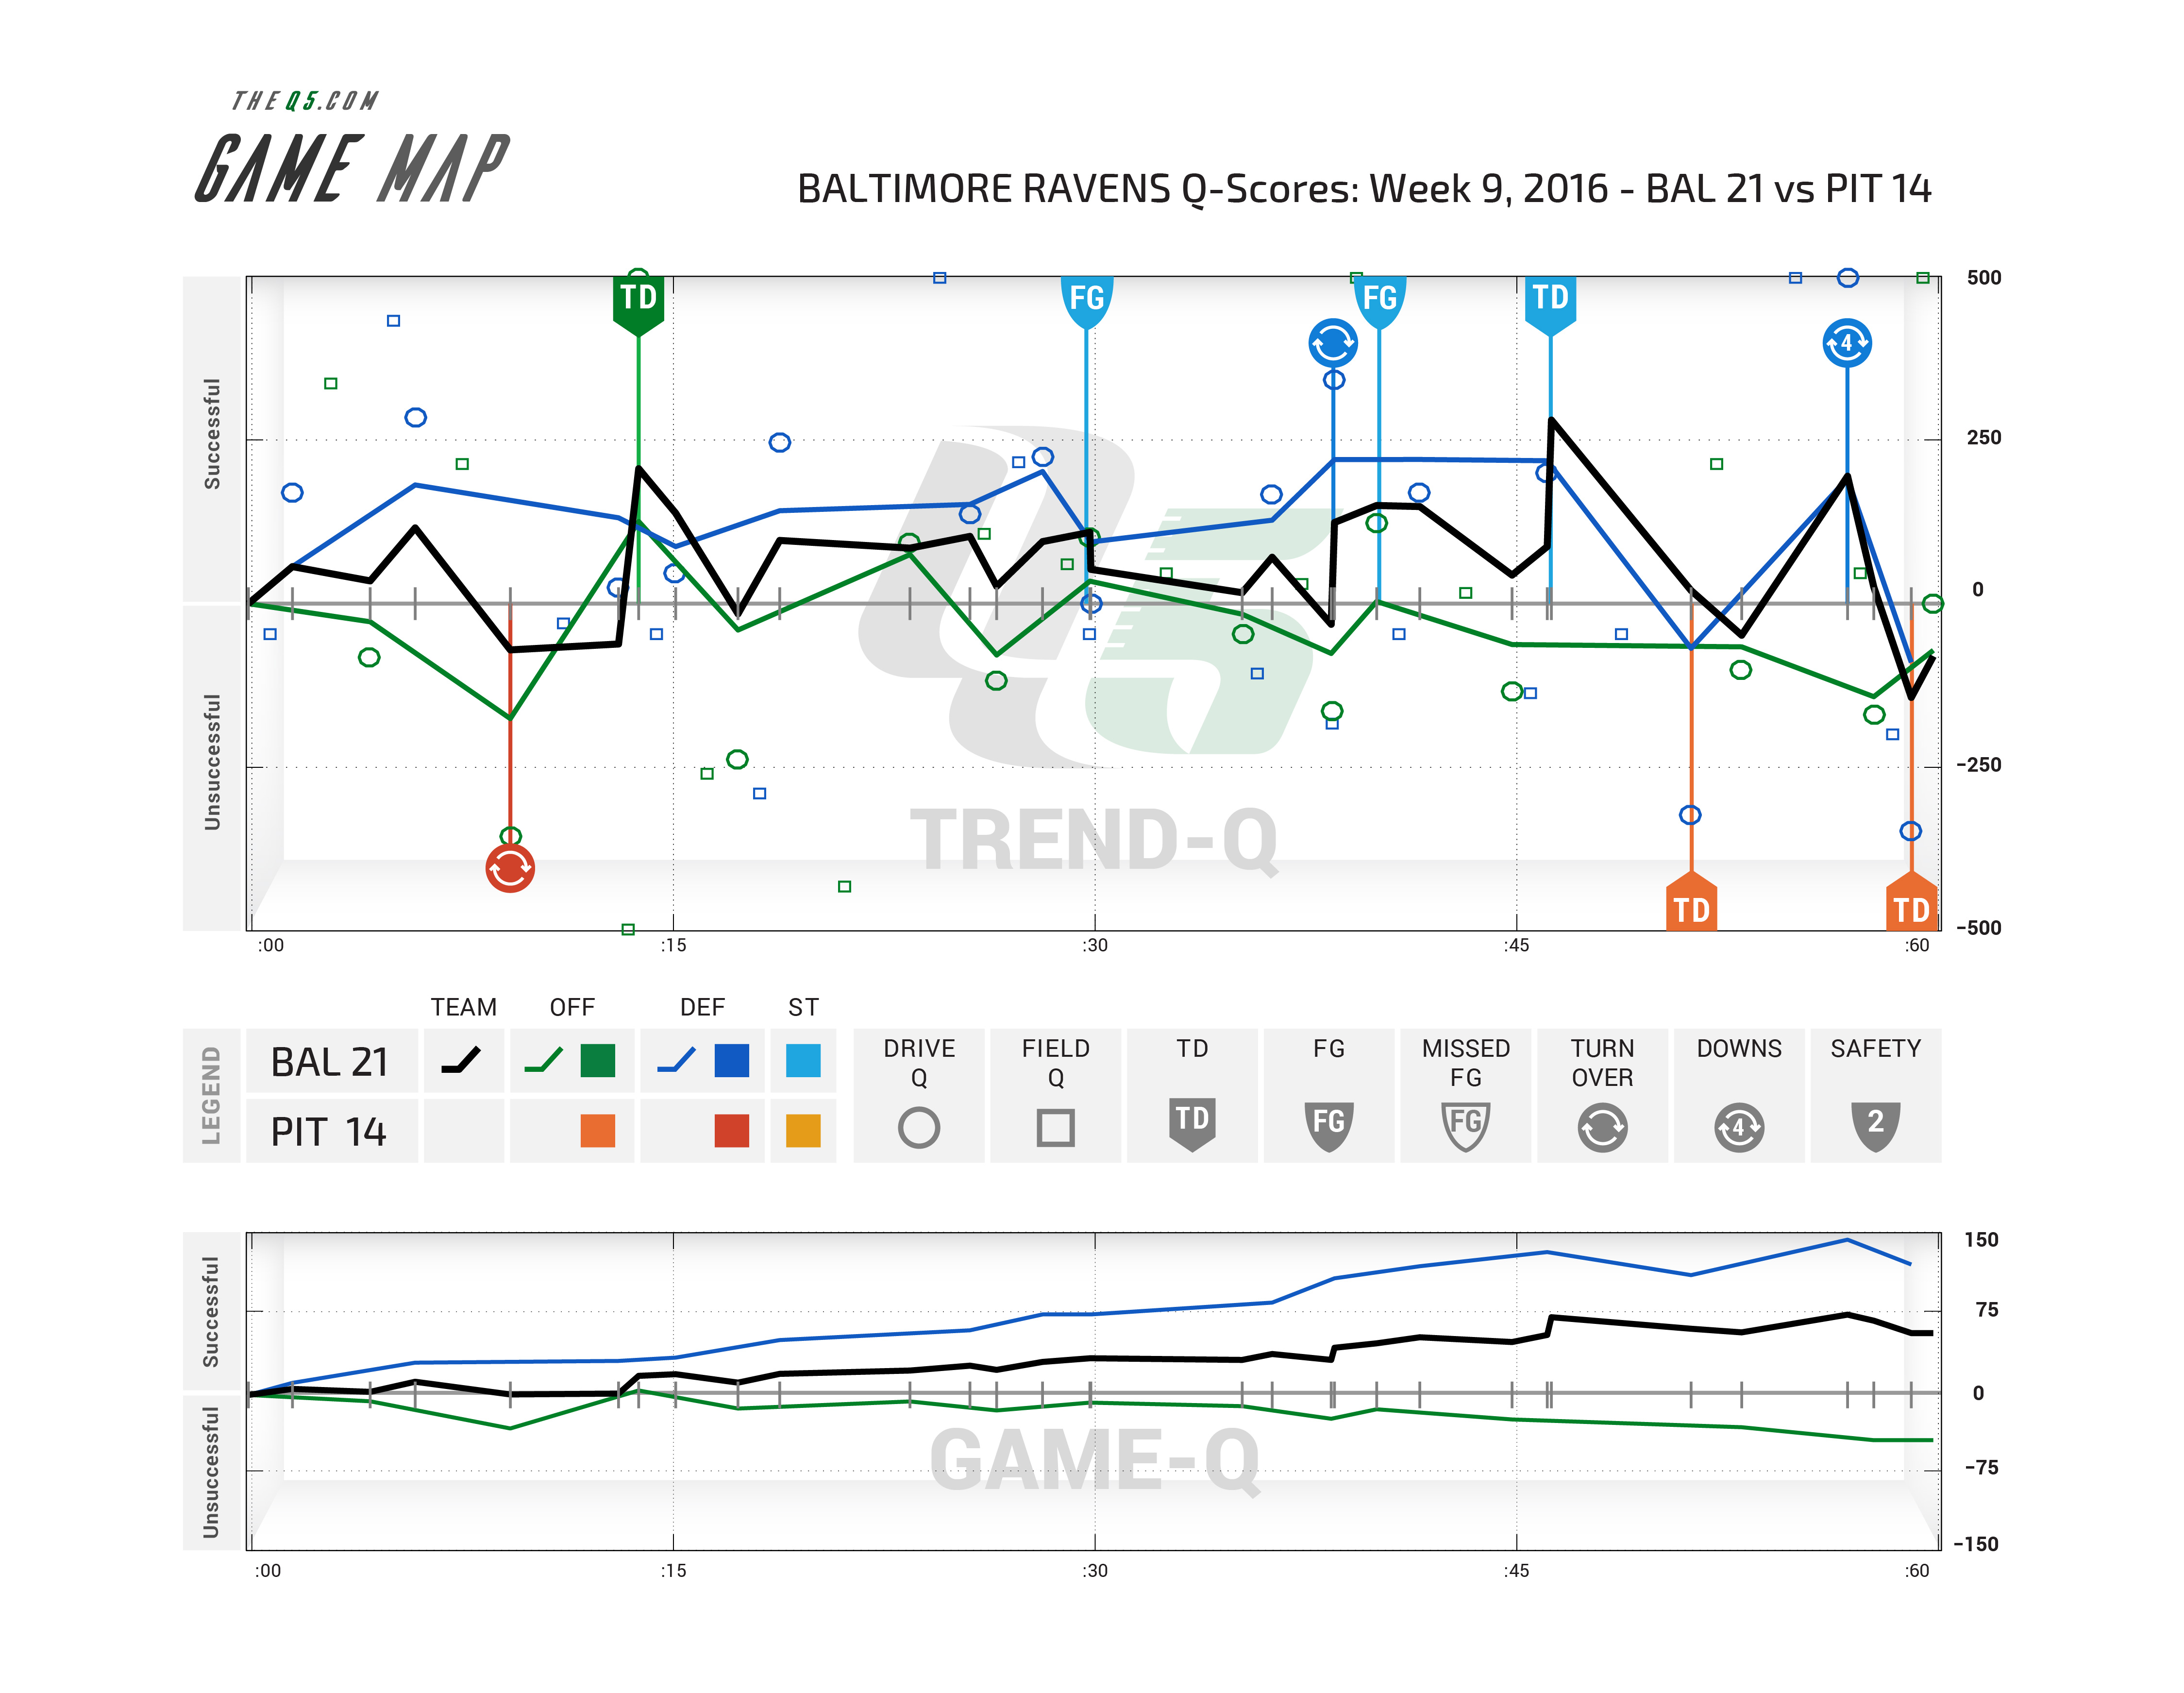
The graphical game summary displays every possession, drive result and drive success in precise time history, replacing multiple clicks on summary statistics, play-by-play logs, drive charts and analysis articles. Drive length ticks on the horizontal game clock axis and metric values on the vertical axis marked at drive-ending locations. Distinctly colored labels define all possible possession outcomes, except punts, which are unmarked. A quick study of this visualization by spectators or participants is meaningful in both real-time or reflection.
Of the two participants, one is defined as the focus team for the visualization. The team name appears in the header. The GameMap is created from the perspective of the focus team. All success measures are in reference to the focus team. To create a visualization of the non-focus team, the plot would be flipped around the horizontal axis and colors altered. In other words, the inverse of the focus team is, by definition, its opponent.
The game clock is presented left to right, horizontally. The plots read as a time history of the game and possession action, flowing left to right. The teams involved, with the focus team on top, are listed in the header as is the score of the game.
The performance metric values are on the vertical axis, qualitatively defined on the left side of the graph and numerically represented on the right side. The horizontal line across the middle represents a performance metric value equal to zero or neutral to both teams. Above the neutral line is success for the focus team and below the neutral line is the opposite. The further from the neutral line, the more extreme the performance in either a successful or unsuccessful manner.
Week 9, 2016: In Baltimore Ravens 3-4 and Steelers 4-3 coming into the game. Including this win, the Ravens have gone 5-2 and given themselves the chance to make the playoffs. Including this loss, Steelers also have gone 5-2 but have won 5 straight.
Week 16, 2015: In a well documented 5-11 season, the Ravens swept the Steelers in 2015. Steelers went 10-6 and made it the divisional round of the playoffs before losing in Denver.

Week 4, 2015:

Wildcard Game, 2014: The Steelers went 11-5 in 2014 and lost in the wildcard round to the Ravens.

Week 9, 2014:

Week 2, 2014:


Dr. Guyader is the Owner / Founder of The Q5.com, which specializes in Football Visualizations and Drive Analytics. Additionally, Guyader has 10 years of Division I football experience coaching top-tier and historic programs. From guiding third round NFL draft pick Ramses Barden for four seasons at Cal Poly to converting 6-foot 10-inch lineman Ali Villanueva to wide receiver at the United States Military Academy at West Point, Andy knows how to coach on the field and how to game-plan in a meeting.